|
2.4 Solving Quadratic Inequalities |
|
|
|
Prerequisite knowledge and skills |
|
|
|
|
|
|
|
· factor · inequality · interval · leading coefficient · x-intercepts · zero of a function |
|
|
|
Skill prep: Determining which values make an expression positive, negative, or zero |
|
Concept prep assignment: Determining intervals for which a graph is positive, negative or 0. |
|
|
|
|
|
|
|
2.4.1 Solutions from graphs |
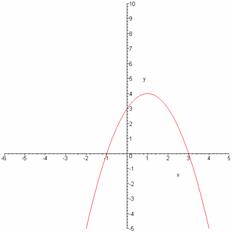
Let’s look at some of the graphs from the concept prep assignment.
|
|
The
function, f, given by a possible formula for this function. Notice that the function outputs are negative when the input
values are in the interval
|
|
The output values are positive when the output values
are in the intervals
|
|
|
Negative function outputs here. (Function outputs are the y-coordinates) |
|
|
|
|
|
|
|
|
|
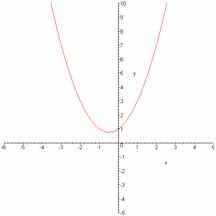
This
parabola has no x-intercepts and
only positive output, or y values. We
say the function values are positive in the interval
|
|
|
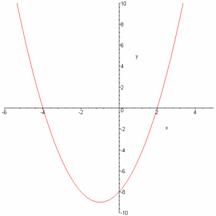
The
x-intercepts are -1 and 3, so the
factors are
|
|
|
The function outputs are positive when the input values are in the interval |
|
|
|
|
|
The
function outputs are negative when
the input values are in the intervals
|
![]()
|
|
||
|
|
||
|
2.4.2 Algebraic Solutions |
||
|
|
||
|
In practice it is helpful to know how to solve these inequalities algebraically in addition to graphically. You may not always have a graphing utility handy; knowing more than one way of solving it deepens your understanding. |
||
|
|
||
|
|
||
|
Example 1. Solve |
||
|
|
||
|
1. Get one side equal to 0.
Already done: |
||
|
|
||
|
2. Factor the quadratic. Already done: |
||
|
|
||
|
3. Find the zeros of the
function: |
||
|
|
||
|
|
||
|
|
||
|
These numbers are sometimes called critical numbers because the function may change from positive to negative (or vice versa) at these values of the input. |
||
|
|
||
|
Now
think a minute. We need to find out
for which inputs (x -values) are
the outputs (the y |
||
|
|
||
|
|
||
|
|
||
|
|
||
|
|
||
|
|
||
|
|
||
|
|
||
|
|
||
|
|
||
|
|
||
|
|
||
|
|
||
|
|
||
|
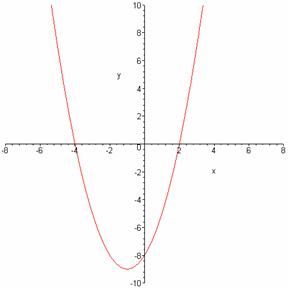
Recall the graph of this quadratic function: |
||
|
|
||
|
If the function outputs are equal to 0 at |
||
|
|
||
|
of
the output in between |
||
|
|
||
|
Do you see how they all have the same sign, |
||
|
in this case negative? |
||
|
|
||
|
Do you see that all the outputs to the left of |
||
|
|
||
|
|
||
|
Do you see that all the outputs to the right of |
||
|
2
also have the same sign |
||
|
|
||
|
|
||
|
One way of organizing this information algebraically is to use something called a sign chart. |
||
|
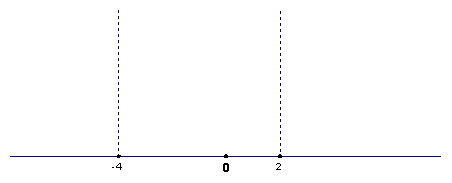
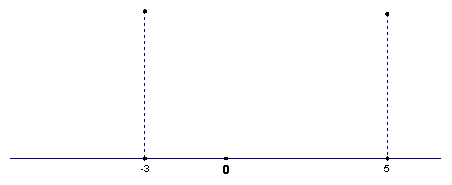
A sign chart uses the number line with the critical numbers (the zeros of the function) as endpoints of intervals. The beginning of a sign chart for the problem above would look like this: |
||
|
|
||
|
4. Create a sign chart. |
||
|
|
|
|
|
|
|
|
|
|
|
|
|
|
|
|
|
|
|
|
|
|
|
|
|
|
|
|
|
|
|
|
|
|
|
|
|
|
||
|
|
||
|
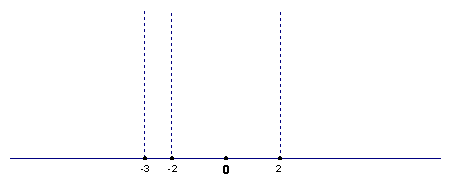
We plan to determine the sign (positive or negative) of each factor in each of these intervals, so we write each factor on the left side of the number line and the complete factored form near the bottom, like this: |
||
|
|
||
|
5. Write each factor on the sign chart. |
||
|
|
||
|
|
||
|
|
||
|
|
||
|
|
||
|
|
||
|
|
||
|
|
||
|
|
||
|
|
||
|
|
||
|
|
||
|
|
||
|
|
||
|
We will analyze each factor separately using test numbers. |
||
|
|
||
|
|
||
|
|
||
|
|
||
|
6. Choose ANY NUMBER in an interval as a test number. |
||
|
|
||
|
Recall that the function changes sign only at the critical numbers. Recall also that our intervals have these critical numbers as endpoint. This means that all inputs in each interval will have outputs with the same sign. |
||
|
|
||
|
(THINK ABOUT THIS LAST SENTENCE UNTIL IT MAKES SENSE TO YOU. REREAD IT OVER AND OVER UNTIL YOU UNDERSTAND WHAT IT’S SAYING. REMEMBER WHAT THE GRAPHS LOOK LIKE. TALK TO YOUR GROUP MEMBERS ABOUT IT.) |
||
|
|
||
|
|
||
|
|
||
|
|
||
|
Left interval: |
||
|
|
||
|
Middle interval: |
||
|
and |
||
|
|
||
|
Right interval: |
||
|
and |
||
|
|
||
|
7.
Summarize your work on the sign chart by placing
the appropriate sign ( |
||
|
|
||
|
|
||
|
(x+4) - + + |
||
|
(x-2) - - + |
||
|
|
||
|
(x+4)(x-2) + - + |
||
|
|
||
|
|
||
|
|
||
|
|
||
|
Can you see which interval is the solution? For which x values are the outputs less than 0? |
||
|
|
||
|
|
||
|
|
||
|
|
||
|
|
||
|
The solution interval is (-4,2). |
||
|
|
||
|
|
||
|
|
||
|
|
||
|
|
||
|
|
||
|
|
||
|
|
||
|
|
||
|
|
||
|
|
||
|
|
||
|
|
||
|
|
||
|
|
||
|
|
||
|
|
||
|
|
||
|
|
||
|
|
||
|
|
||
|
|
||
|
|
||
Steps for solving a quadratic inequality algebraically:
1. Move all terms to one side of the polynomial so that the other side = 0.
2. Factor the polynomial and find the critical numbers.
3. Make a sign chart with these critical numbers as interval endpoints.
List the factors to the left.
4. Analyze the sign of each factor in each interval using test numbers.
5. Multiply the signs together in each interval and decide upon the solution
interval(s).
|
Example 2. Solve |
|
|
|
1.
Get one side = 0: |
|
2.
Factor and find the critical numbers. |
|
are x = 5 and x = -3. |
|
|
|
3. Put the critical numbers on a sign chart and list the factors to the left. |
|
|
|
|
|
|
|
|
|
|
|
|
|
|
|
|
|
|
|
|
|
|
|
4. Analyze the sign of each factor in each interval using test numbers. |
|
|
|
|
|
|
|
|
|
|
|
|
|
|
|
|
|
|
|
If x = -4, then |
|
and |
|
|
|
If x
= 0 , then |
|
and |
|
|
|
If x =
6 , then |
|
and |
|
|
|
5. Multiply the signs together in each interval and |
|
|
|
|
|
|
|
|
|
|
|
|
|
|
|
|
|
|
|
The
solution intervals are |
|
Be sure to check that graphical representation of the function supports our answer. |
|
|
|
|
|
|
|
Example 3. Solve the inequality |
|
|
|
1.
Get one side = 0: |
|
|
|
|
|
2.
Factor and find the critical
numbers. |
|
|
|
The critical numbers are |
|
|
|
3.
|
|
|
|
|
|
|
|
|
|
|
|
|
|
|
|
|
|
|
|
4. Analyze the sign of each factor in each interval using test numbers. |
|
|
- -
+ +
|
|
|
|
|
|
|
|
|
|
|
|
|
|
|
|
|
|
|
These details are left for you. Which test numbers did you pick? Do your signs agree with those in the above chart? |
|
|
|
|
|
|
|
|
5. Multiply the signs together in each interval and |
|
|
|
|
|
|
|
|
|
|
|
|
|
|
|
|
|
|
|
|
|
|
|
|
|
|
|
|
|
Less than zero means look for intervals with negative product. |
|
|
|
|
|
|
|
|
|
|
|
The
solution to |
|
|
|
|
|
Check to see if the graphical representation supports our solution. |
|
|
|
|
|
|
|
|
|
|
|
|
|
|
|
|
|
|
|
|
|
|
|
|
|