|
2.4 Introduction: Solving Quadratic Inequalities |
|
|
|
Recall the real-world scenario discussed in Section 2.1 . It is reprinted below for your convenience. |
|
|
|
Suppose that you run a Music Store and the revenue
in thousands of dollars from the sale of x thousand CDs is given by |
|
|
|
Recall that to answer the above question, we set the function equal to 0 and solved it. Now |
|
suppose we wanted to know when the revenue was negative, i.e. when would the business be going in the hole? We need to find the exact point where the revenue changes from positive to negative. In other words, first we need to find where the revenue is zero. This is the problem we already solved in Section 2.1. We set the function = 0 and solved it: |
|
|
|
|
|
|
|
Factor: |
|
Set each factor =
0: |
|
|
|
Thus
we had two values of n for which
the Revenue was 0, n = 0 or n = |
|
|
|
|
|
|
|
|
|
|
|
|
|
|
|
|
|
|
|
|
|
|
|
|
|
|
|
|
|
|
|
|
|
|
|
|
|
|
|
|
|
|
|
|
|
|
|
|
|
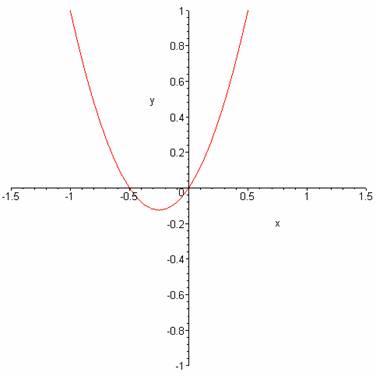
Notice
that the output is negative for |
|
|
|
In the following section, we will be solving problems like these, i.e. we will be looking for intervals for which the output of a quadratic function is positive or negative . We call these types of problems quadratic inequalities. |
|
|
|
|
|
|