|
4.2 More About Asymptotes |
||||||||||||||||||||||||||||||
|
|
||||||||||||||||||||||||||||||
|
Goals: |
||||||||||||||||||||||||||||||
|
||||||||||||||||||||||||||||||
|
· Graph a transformation of a simple rational function using vertical or horizontal shifts |
||||||||||||||||||||||||||||||
|
· Understands the effects of shifting on the asymptotes of the graph |
||||||||||||||||||||||||||||||
|
|
||||||||||||||||||||||||||||||
|
· asymptote |
· function |
|||||||||||||||||||||||||||||
|
· domain of a function |
· rational function |
|||||||||||||||||||||||||||||
|
|
||||||||||||||||||||||||||||||
|
|
||||||||||||||||||||||||||||||
|
|
||||||||||||||||||||||||||||||
|
The Effect of Adding a Constant, k |
||||||||||||||||||||||||||||||
|
|
||||||||||||||||||||||||||||||
|
You may recall from section 2.3 that
adding a constant to an exponential function resulted in a vertical shift of
the original graph. For example, the
graph of |
||||||||||||||||||||||||||||||
|
|
||||||||||||||||||||||||||||||
|
||||||||||||||||||||||||||||||
|
|
||||||||||||||||||||||||||||||
|
|
||||||||||||||||||||||||||||||
|
We notice that as |
||||||||||||||||||||||||||||||
|
|
||||||||||||||||||||||||||||||
|
Now let’s examine what
happens to the values |
||||||||||||||||||||||||||||||
|
|
||||||||||||||||||||||||||||||
|
Since |
||||||||||||||||||||||||||||||
|
In conclusion, the
horizontal asymptote of the graph of |
||||||||||||||||||||||||||||||
|
|
||||||||||||||||||||||||||||||
|
|
||||||||||||||||||||||||||||||
|
|
||||||||||||||||||||||||||||||
|
Asymptotes
for The
horizontal asymptote of a rational
function of the form The vertical
asymptote is |
||||||||||||||||||||||||||||||
|
|
||||||||||||||||||||||||||||||
|
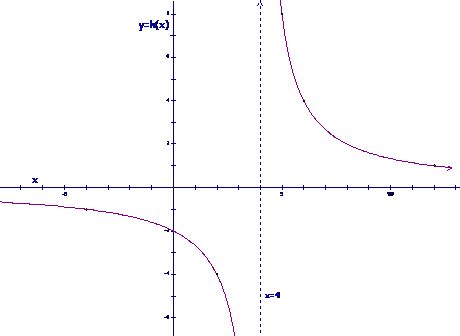
Example 1.
Name the asymptotes of the graph of |
||||||||||||||||||||||||||||||
|
Note that 8 is added on to the output of which has
|
The
horizontal asymptote is |
|||||||||||||||||||||||||||||
|
|
|
|||||||||||||||||||||||||||||
|
Note that as
|
The vertical asymptote is
|
|||||||||||||||||||||||||||||
|
|
||||||||||||||||||||||||||||||
|
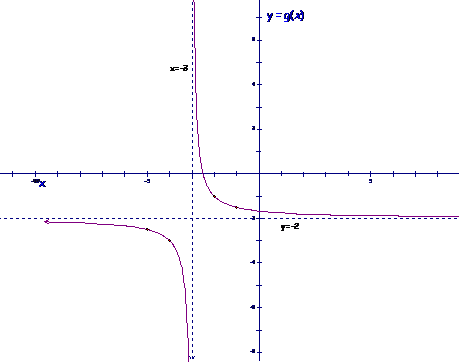
Example 2.
Name the asymptotes of the graph of |
||||||||||||||||||||||||||||||
|
Note that 4 is subtracted from the output of asymptote. |
The
horizontal asymptote is |
|||||||||||||||||||||||||||||
|
|
|
|||||||||||||||||||||||||||||
|
Note that as
|
The vertical asymptote is
|
|||||||||||||||||||||||||||||
|
|
||||||||||||||||||||||||||||||
|
Example 3.
Name the asymptotes of the graph of |
||||||||||||||||||||||||||||||
|
|
||||||||||||||||||||||||||||||
|
Note that 1 is added to the output of asymptote. |
The horizontal asymptote is
|
|||||||||||||||||||||||||||||
|
|
|
|||||||||||||||||||||||||||||
|
Note that f as or
|
The vertical asymptote is
|
|||||||||||||||||||||||||||||
|
|
||||||||||||||||||||||||||||||
|
Example 4.
Name the asymptotes of the graph of |
||||||||||||||||||||||||||||||
|
|
||||||||||||||||||||||||||||||
|
Note that 7 is subtracted from the output of asymptote. |
The
horizontal asymptote is |
|||||||||||||||||||||||||||||
|
|
|
|||||||||||||||||||||||||||||
|
Note that as
|
The vertical asymptote is
|
|||||||||||||||||||||||||||||
|
|
||||||||||||||||||||||||||||||
|
Example 5.
Name the asymptotes of the graph of |
||||||||||||||||||||||||||||||
|
|
||||||||||||||||||||||||||||||
|
Note that 10 is added to the output of asymptote. |
The
horizontal asymptote is |
|||||||||||||||||||||||||||||
|
|
|
|||||||||||||||||||||||||||||
|
Note that as
|
The vertical asymptote is
|
|||||||||||||||||||||||||||||
|
|
||||||||||||||||||||||||||||||
|
|
||||||||||||||||||||||||||||||
|
Finding the Domain of a Rational Function To find the domain of a rational function, consider the values of the input, x, which make the function undefined. The domain is all real numbers EXCEPT these values. |
||||||||||||||||||||||||||||||
|
|
||||||||||||||||||||||||||||||
|
Example 6.
Find the domain of the function f
given by |
||||||||||||||||||||||||||||||
|
|
||||||||||||||||||||||||||||||
|
Set the denominator equal to 0 and solve: |
|
|||||||||||||||||||||||||||||
|
|
|
|||||||||||||||||||||||||||||
|
The domain is all real numbers EXCEPT this value. |
So, the domain is all real numbers except 3. |
|||||||||||||||||||||||||||||
|
|
|
|||||||||||||||||||||||||||||
|
Write the answer in set notation or as an interval |
|
|||||||||||||||||||||||||||||
|
|
|
|||||||||||||||||||||||||||||
|
|
||||||||||||||||||||||||||||||
|
Example 7.
Find the domain of the function g
given by |
||||||||||||||||||||||||||||||
|
|
||||||||||||||||||||||||||||||
|
Set the denominator equal to 0 and solve: |
|
|||||||||||||||||||||||||||||
|
The domain is all real numbers EXCEPT this value. |
So, the domain is all real numbers except -1. |
|||||||||||||||||||||||||||||
|
Write the answer in set notation or as an interval |
|
|||||||||||||||||||||||||||||
|
|
||||||||||||||||||||||||||||||
|
Example 8.
Find the domain of the function
h given by |
||||||||||||||||||||||||||||||
|
|
||||||||||||||||||||||||||||||
|
Set the denominator equal to 0 and solve: |
|
|||||||||||||||||||||||||||||
|
The domain is all real numbers EXCEPT this value.
|
So, the domain is all real numbers except
|
|||||||||||||||||||||||||||||
|
|
|
|||||||||||||||||||||||||||||
|
Write the answer in set notation or as an interval |
|
|||||||||||||||||||||||||||||
|
|
||||||||||||||||||||||||||||||
|
Vertical Asymptotes Revisited |
||||||||||||||||||||||||||||||
|
|
||||||||||||||||||||||||||||||
|
Recall from section 4.1 that
the vertical asymptote of a reciprocal function, f, given by |
||||||||||||||||||||||||||||||
|
|
||||||||||||||||||||||||||||||
|
We noted above that this
function is undefined at |
||||||||||||||||||||||||||||||
|
|
||||||||||||||||||||||||||||||
|
|
||||||||||||||||||||||||||||||
|
|
||||||||||||||||||||||||||||||
|
We see that
the outputs are increasing without bound, that is, |
||||||||||||||||||||||||||||||
|
|
||||||||||||||||||||||||||||||
|
So now we
have |
||||||||||||||||||||||||||||||
|
|
||||||||||||||||||||||||||||||
|
Vertical Asymptote Given a constant, h, the line
as |
||||||||||||||||||||||||||||||
|
|
||||||||||||||||||||||||||||||
|
If we make
similar tables for functions f of the form |
||||||||||||||||||||||||||||||
|
|
||||||||||||||||||||||||||||||
|
|
||||||||||||||||||||||||||||||
|
Vertical Asymptote of a Rational Function For
a rational function of the form |
||||||||||||||||||||||||||||||
|
|
||||||||||||||||||||||||||||||
|
Thus, the vertical asymptote
of the graph of g in example 7
above is |
||||||||||||||||||||||||||||||
|
|
||||||||||||||||||||||||||||||
|
|
||||||||||||||||||||||||||||||
|
Putting it all together: Graphing a Rational Function |
||||||||||||||||||||||||||||||
|
|
||||||||||||||||||||||||||||||
|
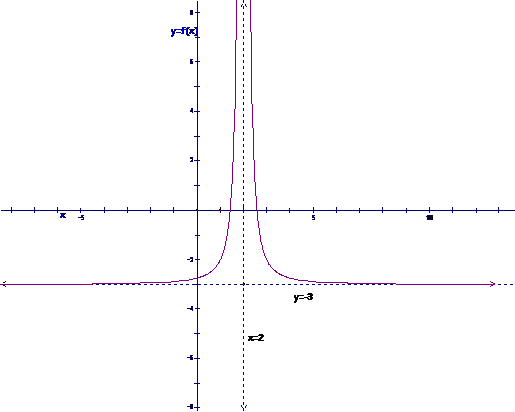
Example 9.
Name the domain and asymptotes of the function h given by |
||||||||||||||||||||||||||||||
|
|
||||||||||||||||||||||||||||||
|
Set the denominator equal to 0 to find the domain: |
So the domain is
|
|||||||||||||||||||||||||||||
|
The domain provides us with information about the vertical asymptote:
|
|
|||||||||||||||||||||||||||||
|
The end behavior provides information about the horizontal asymptote: |
As |
|||||||||||||||||||||||||||||
|
Find the y-intercept by setting |
|
|||||||||||||||||||||||||||||
|
Find the x-intercept by setting |
|
|||||||||||||||||||||||||||||
|
|
|
|||||||||||||||||||||||||||||
|
Finding a few extra points will make our graph more accurate. Picking a few points on either side of the vertical asymptote(s) is a good idea. |
|
|||||||||||||||||||||||||||||
|
|
||||||||||||||||||||||||||||||
|
Plotting the above, we obtain: |
||||||||||||||||||||||||||||||
|
|
||||||||||||||||||||||||||||||
|
The graph of |
||||||||||||||||||||||||||||||
|
|
||||||||||||||||||||||||||||||
|
Note that the range (the set
of all outputs) is the set of all real numbers except 0. The function is
decreasing over its entire domain, that is it is decreasing over |
||||||||||||||||||||||||||||||
|
|
||||||||||||||||||||||||||||||
|
Example 10.
Name the domain and asymptotes of the function h given by |
||||||||||||||||||||||||||||||
|
|
||||||||||||||||||||||||||||||
|
Set the denominator equal to 0 to find the domain: |
So
the domain is |
|||||||||||||||||||||||||||||
|
The domain provides us with information about the vertical asymptote:
|
|
|||||||||||||||||||||||||||||
|
The end behavior provides information about the horizontal asymptote:
|
As |
|||||||||||||||||||||||||||||
|
Find the y-intercept by setting |
|
|||||||||||||||||||||||||||||
|
Find
the x-intercept by setting |
So the
point |
|||||||||||||||||||||||||||||
|
Finding a few extra points will make our graph more accurate. Picking a few points on either side of the vertical asymptote is a good idea. |
|
|||||||||||||||||||||||||||||
|
|
||||||||||||||||||||||||||||||
|
Plotting the above, we obtain: |
||||||||||||||||||||||||||||||
|
|
||||||||||||||||||||||||||||||
|
The graph of |
||||||||||||||||||||||||||||||
|
|
||||||||||||||||||||||||||||||
|
Note that the range (the set
of all outputs) is the set of all real numbers except -2, that is |
||||||||||||||||||||||||||||||
|
|
||||||||||||||||||||||||||||||
|
Example 11.
Name the domain and asymptotes of the function h given by |
||||||||||||||||||||||||||||||
|
|
||||||||||||||||||||||||||||||
|
Set the denominator equal to 0 to find the domain: |
So the domain is
|
|||||||||||||||||||||||||||||
|
The domain provides us with information about the vertical asymptote:
|
|
|||||||||||||||||||||||||||||
|
The end behavior provides information about the horizontal asymptote: |
As
|
|||||||||||||||||||||||||||||
|
Find the y-intercept by setting |
|
|||||||||||||||||||||||||||||
|
Find the x-intercept(s) by setting |
|
|||||||||||||||||||||||||||||
|
|
|
|||||||||||||||||||||||||||||
|
Finding a few extra points will make our graph more accurate. Picking a few points on either side of the vertical asymptote is a good idea. |
|
|||||||||||||||||||||||||||||
|
|
||||||||||||||||||||||||||||||
|
The graph of |
||||||||||||||||||||||||||||||
|
|
||||||||||||||||||||||||||||||
|
The range is |
||||||||||||||||||||||||||||||
|
|
||||||||||||||||||||||||||||||
|
|
|
|||||||||||||||||||||||||||||
|
|
||||||||||||||||||||||||||||||